Covering the Planet with Compressed Bitmaps
This is the first post explaining how the pmtiles extract command works to slice a smaller tileset from a larger one. Protomaps Builds contains a daily planet tileset - if you want just Canada, or South America, you can pass pmtiles extract a GeoJSON to get only that region.
The first step in extracting a slice is computing a tile covering for the target region. A covering is the set of all tiles that touch the edge of the region, or lie completely within it. Coverings are also useful for finding if two tilesets overlap. If you’re building tools for the PMTiles format, this covering technique can make your program faster and use less memory.
Polygon Rasterization
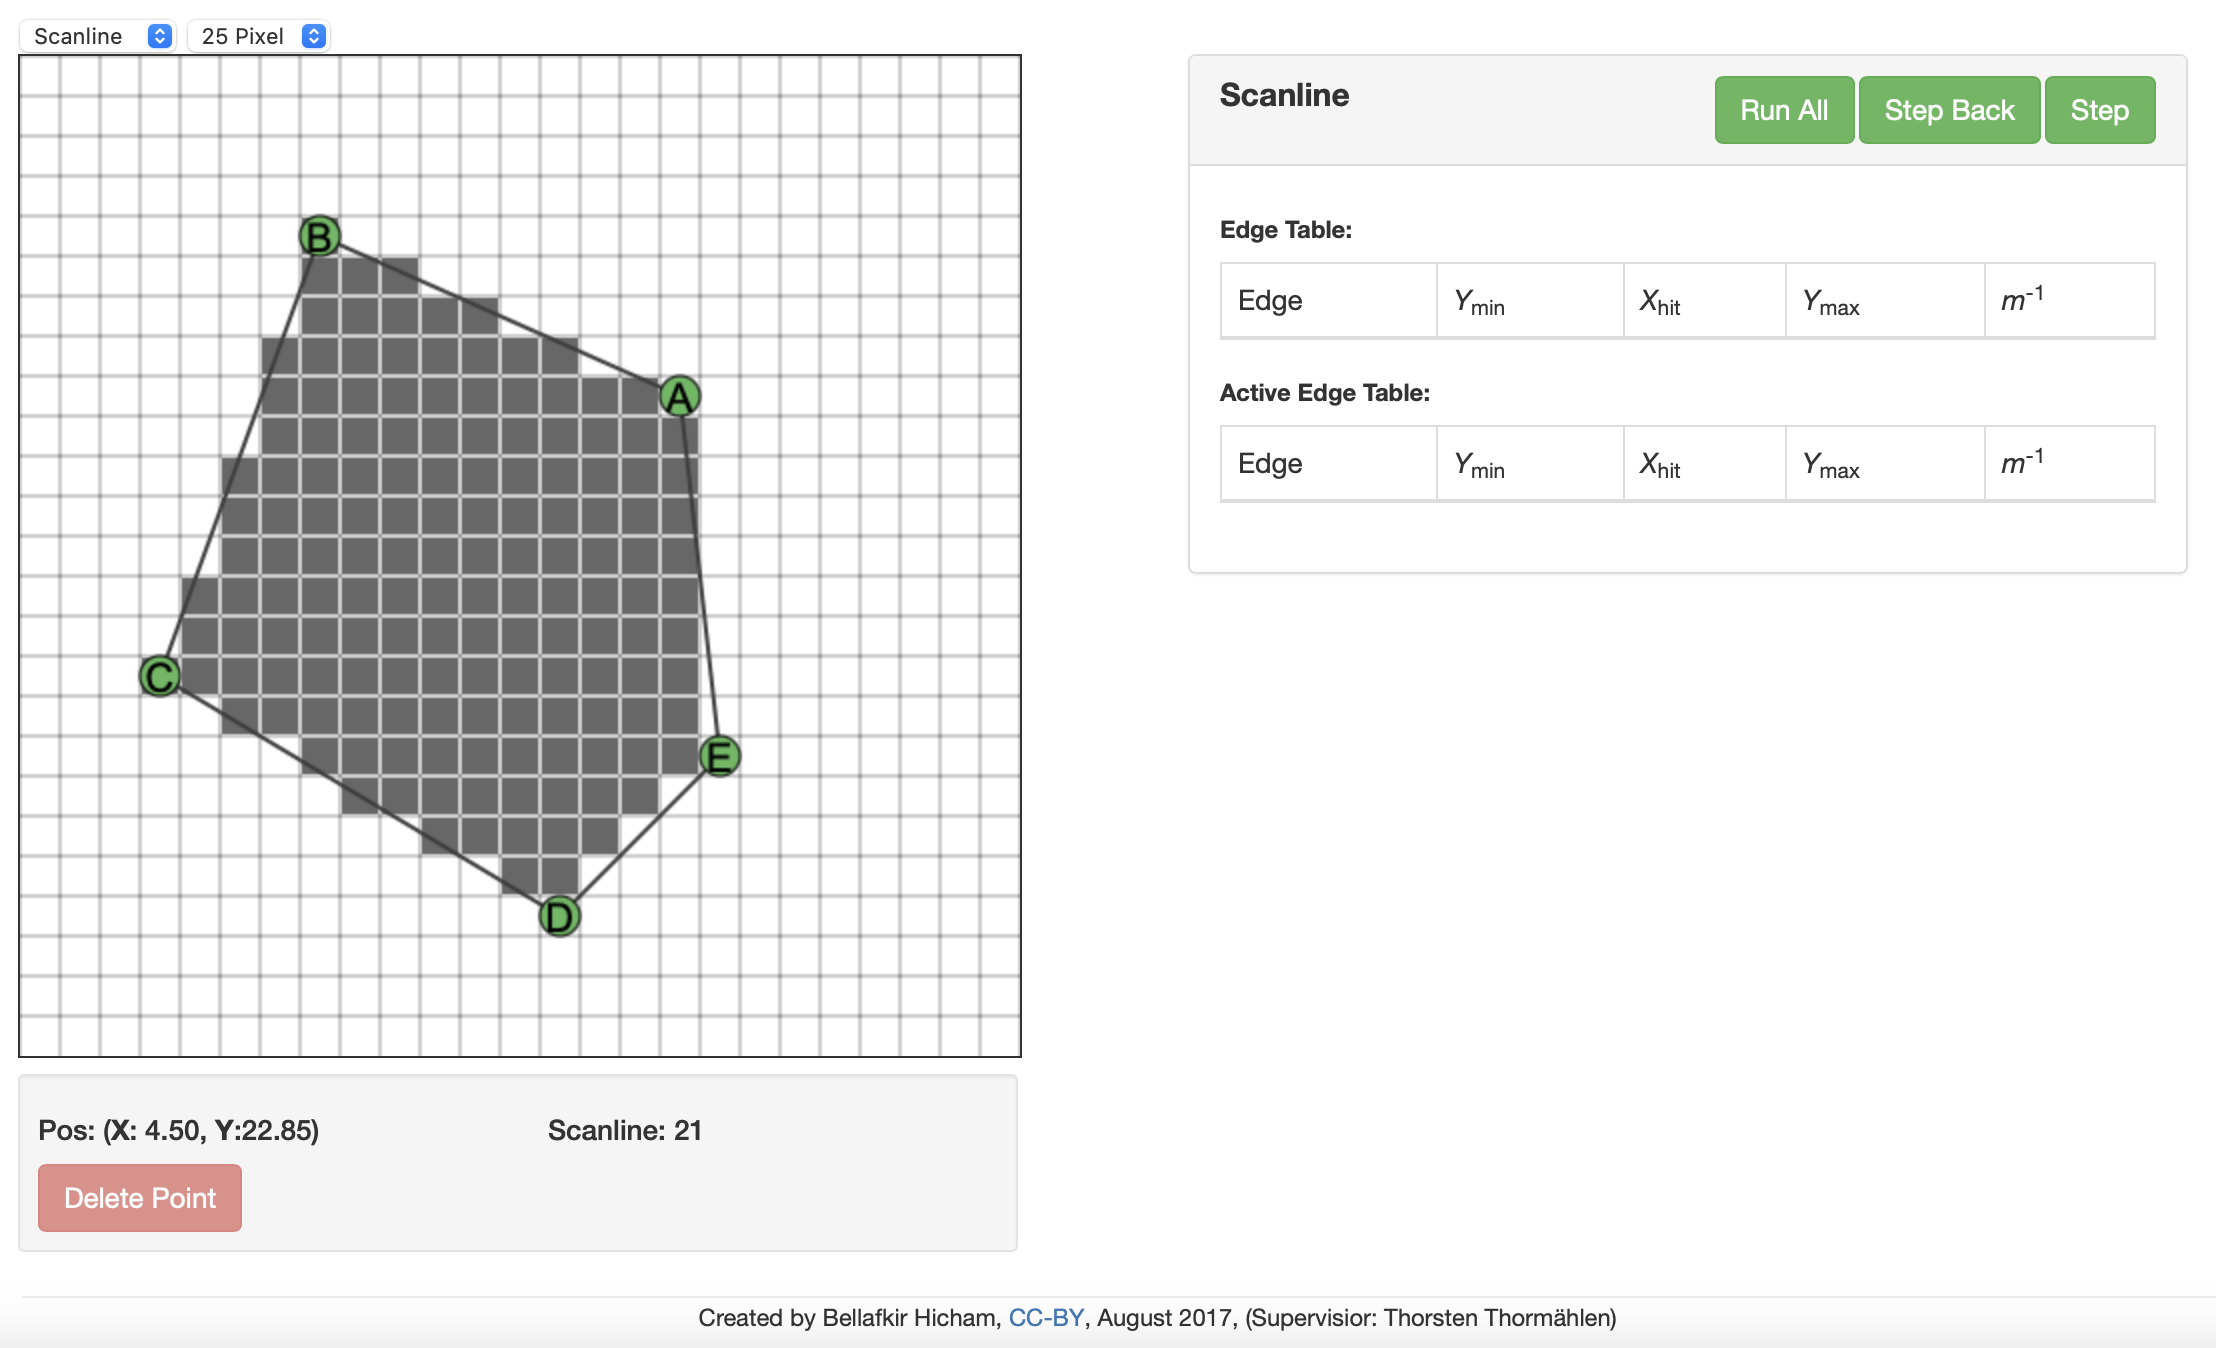
Covering a region with tiles is the same task as polygon rasterization in computer graphics. Start with a polygon like a triangle, then find all the pixels to fill the shape on a screen.
Classical algorithms perform this with scanlines or other algorithms - see this interactive demo to explore methods. For computer graphics, the output is a framebuffer of pixels.
Working with map tiles results in much larger effective screen sizes: the current maximum zoom of the Protomaps basemaps is 15, which is 32768 x 32768 pixels. A region covering for a continent where each entry is stored as (Z,X,Y) in a Set or Hashmap consumes 100+ megabytes of memory.
Data Structure
Instead of holding a Set or Hashmap of pixels, we use a Bitmap - each “pixel” is a single boolean bit in a large array, like a black and white framebuffer image. We use the Hilbert TileID as a 64-bit integer index into the bitmap.
Plain in-memory bitmaps are inefficient, though, because the domain of possible values is large: addressing zoom level 15 addresses over one billion tiles, and storing an array of zeros to set the (0,0) pixel bit at z15 would take up 100+ megabytes.
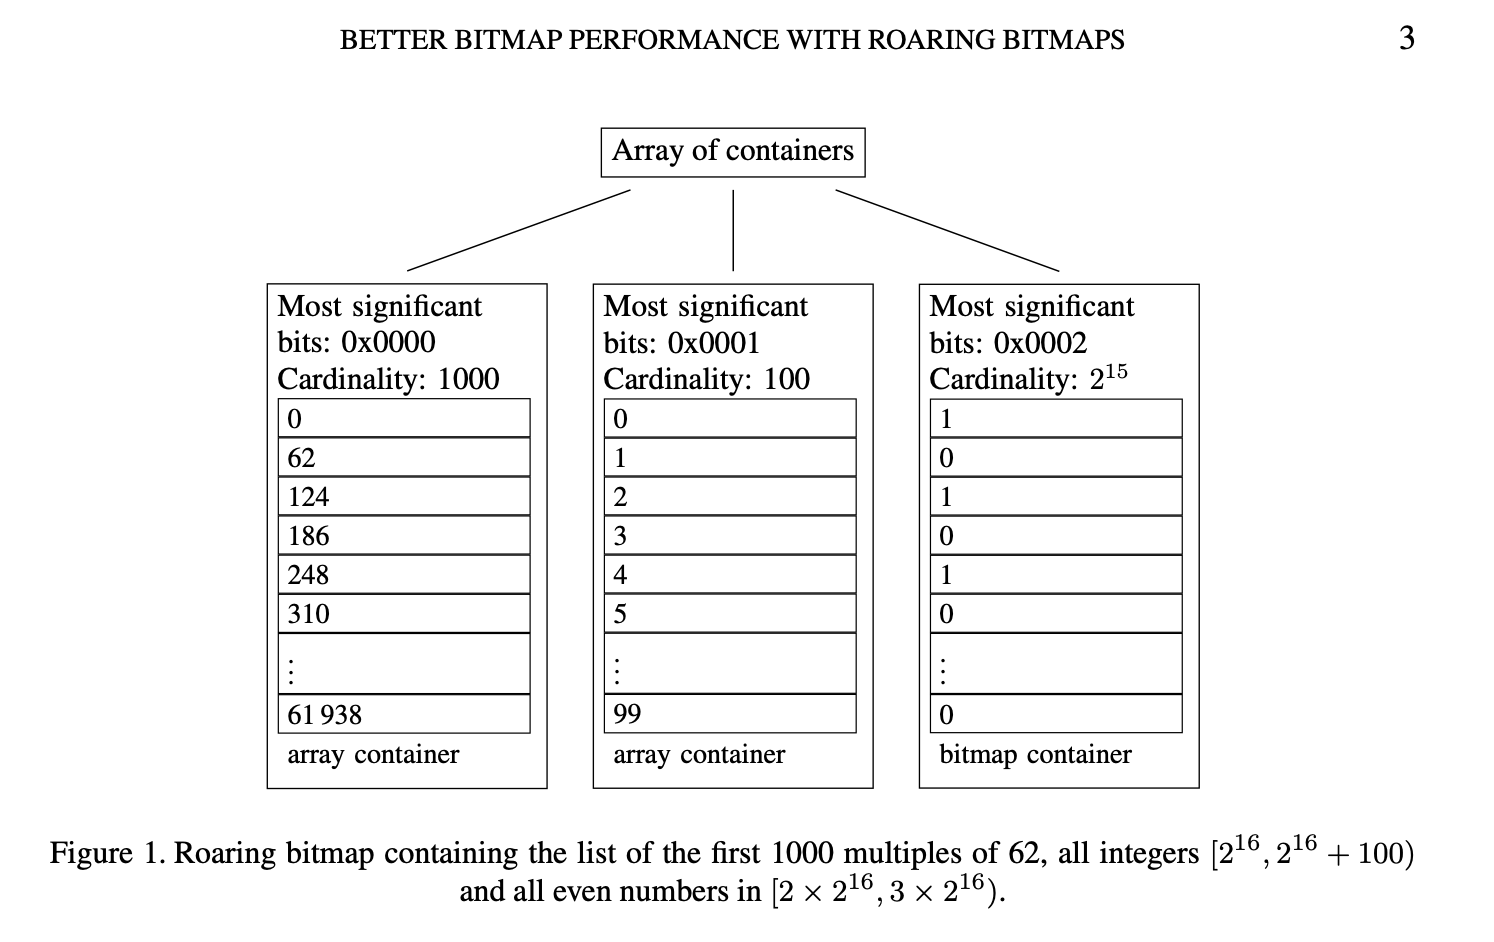
Roaring Bitmaps are a popular implementation of compressed bitmaps. These are especially good for storing regions on space-filling curves because areas occupy continuous parts of the curve, so can be run-length encoded by Roaring.
Roaring Bitmaps are a core part of the software ecosystem around the PMTiles format, but not part of the format itself. It is cheap and easy to construct an in-memory Roaring Bitmap over a set of PMTiles directory entries:
tile_id uint64, offset uint32, length uint32, run_length uint32
roaring = new Roaring()
roaring.addRange(tile_id, tile_id + run_length)
Algorithm
Roaring Bitmaps compactly represent tile coverings, but do not address how to efficiently compute those coverings.
For the PMTiles Tile ID addressing scheme, we start with finding the boundary covering using classical methods, and then exploit the nature of the Hilbert curve: it has has the special property of no jumps - unlike other addressing schemes such as Morton (z-order), or Row/Column major, there are zero discontinuities in the Hilbert Curve. (The Peano curve also shares this property.)
This means that if the curve leaves the region and later enters the region, the intermediate positions on the curve between those two points are either all outside or all inside.
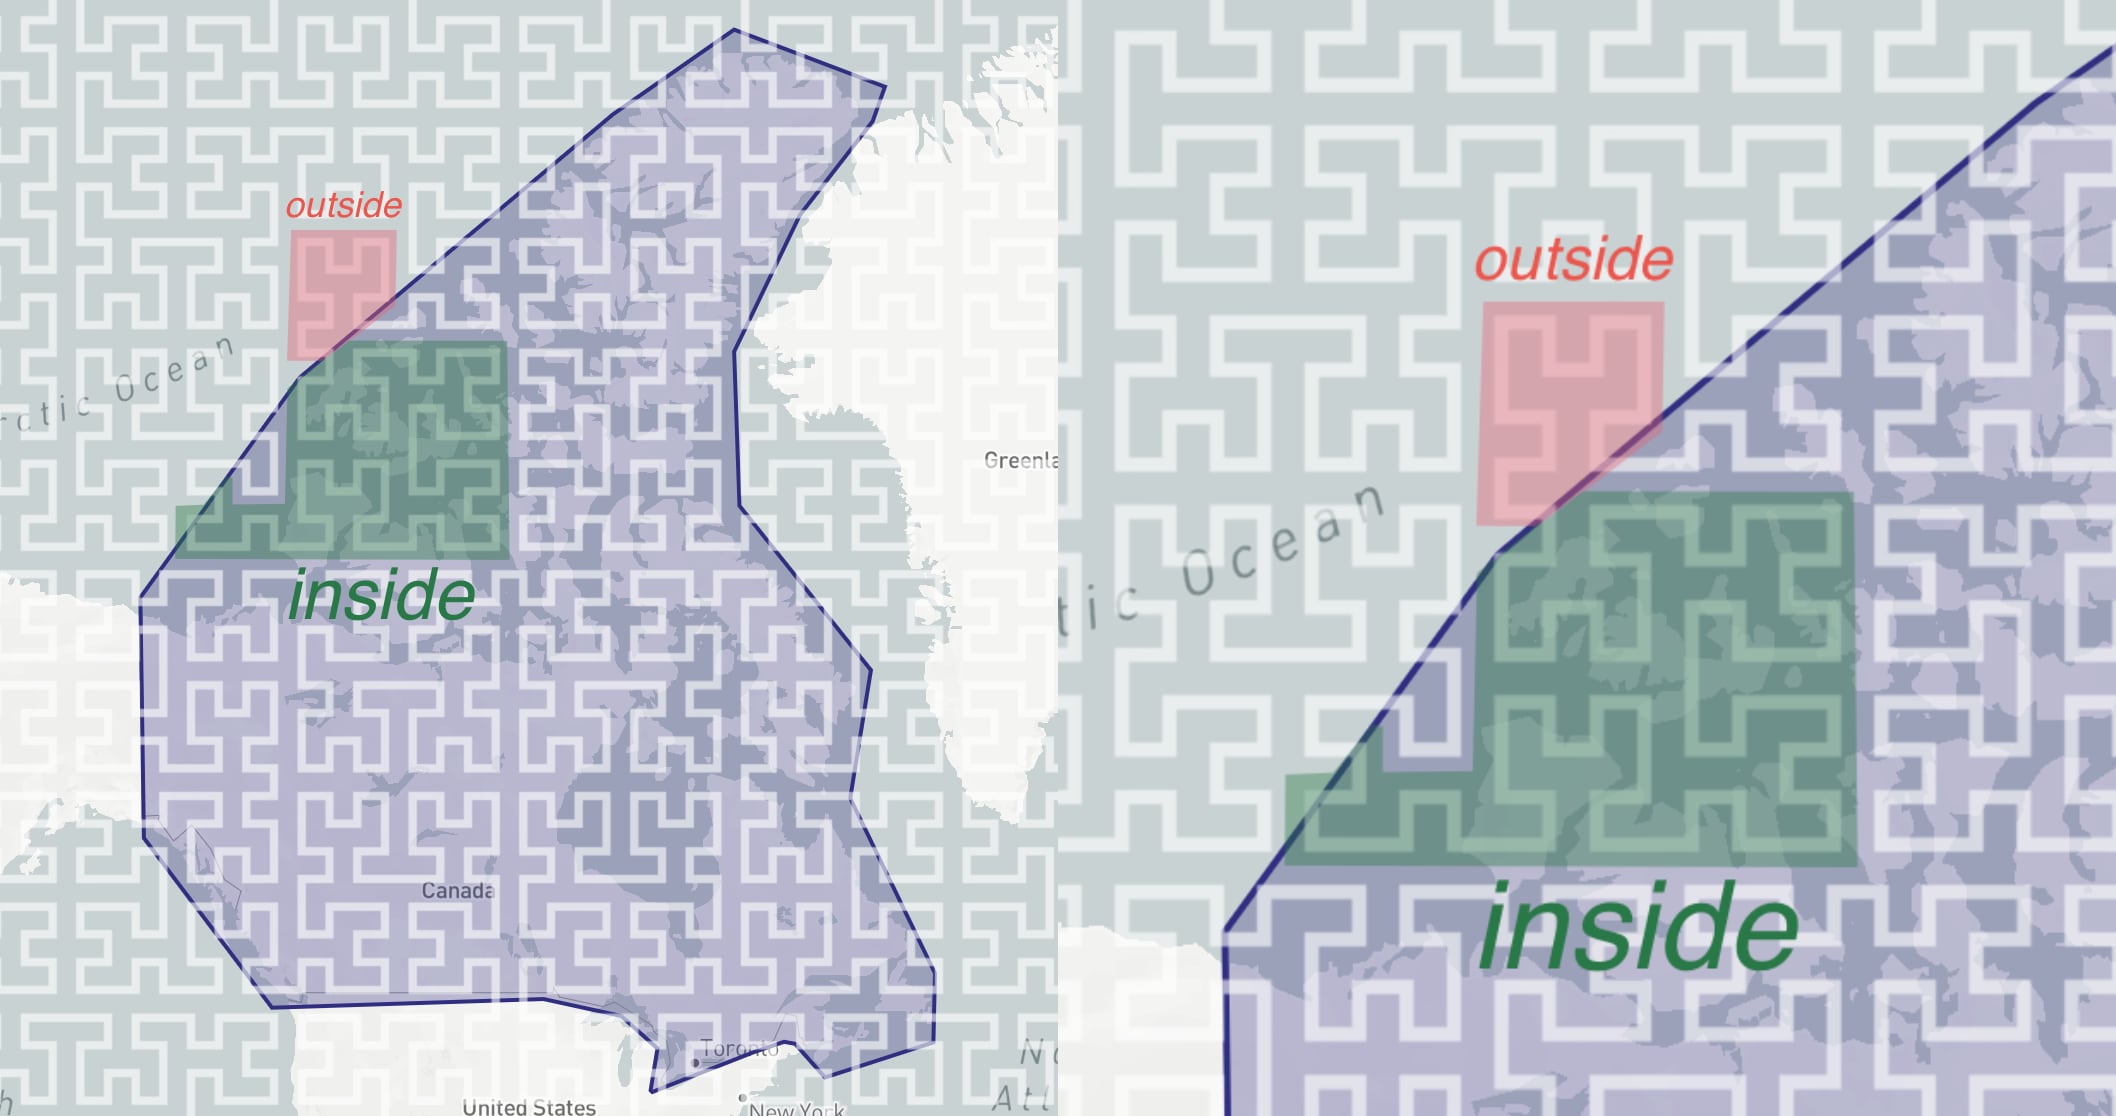
To fill in the interior polygon, iterate over the boundary bitmap and test every gap for whether or not the first tile lies on the interior of the polygon. If it does, add every tile up to the next boundary tile.
Results
The following table shows the growth in RAM usage of the program attached below, which covers the South American continent at different zoom levels using both techniques.
| Zoom | Hashmap (Memory) | Hashmap (Time) | Roaring (Memory) | Roaring (Time) |
|---|---|---|---|---|
| 13 | 54 MB | 150 ms | 3 MB | 7 ms |
| 14 | 207 MB | 754 ms | 4 MB | 13 ms |
| 15 | 823 MB | 3000 ms | 4 MB | 25 ms |
| 16 | 3295 MB | 24000 ms | 4 MB | 47 ms |
| 17 | 13176 MB | 103000 ms | 5 MB | 95 ms |
For the simple hashmap representation of tile coordinates, the memory and runtime grow exponentially as Z increases, because each additional zoom level addresses 4x more tiles. At zoom level 17, it consumes a whopping 13GB of RAM and takes two minutes to compute.
Roaring bitmaps and Hilbert IDs computes the same result in 100 milliseconds and stores the result in 5 megabytes, even at zoom level 17.
Code
A complete, runnable implementation of the compressed bitmap covering algorithm, with comparison to classical techniques, using the paulmach/orb library:
package main

import (
  "fmt"
  "github.com/RoaringBitmap/roaring/roaring64"
  "github.com/paulmach/orb"
  "github.com/paulmach/orb/geojson"
  "github.com/paulmach/orb/maptile"
  "github.com/paulmach/orb/maptile/tilecover"
  "github.com/paulmach/orb/planar"
  "github.com/paulmach/orb/project"
  "github.com/protomaps/go-pmtiles/pmtiles"
  "io/ioutil"
  "runtime"
  "time"
)

func BitmapCovering(zoom uint8, polygon orb.Polygon) (*roaring64.Bitmap, *roaring64.Bitmap) {
  // compute the covering of the boundary linear ring
  boundarySet := roaring64.New()
  for _, ring := range polygon {
    boundaryTiles, _ := tilecover.Geometry(orb.LineString(ring), maptile.Zoom(zoom))
    for tile := range boundaryTiles {
      boundarySet.Add(pmtiles.ZxyToID(uint8(tile.Z), tile.X, tile.Y))
    }
  }

  // Prepare the polygon in Web Mercator for point-in-polygon testing
  polygonProjected := project.Polygon(polygon.Clone(), project.WGS84.ToMercator)

  interiorSet := roaring64.New()
  i := boundarySet.Iterator()
  for i.HasNext() {
    id := i.Next()

    // For every gap between tile IDs in the boundary, check if the next tile
    // is inside or outside using point-in-polygon
    if !boundarySet.Contains(id+1) && i.HasNext() {
      z, x, y := pmtiles.IDToZxy(id + 1)
      tile := maptile.New(x, y, maptile.Zoom(z))
      if planar.PolygonContains(polygonProjected, project.Point(tile.Center(), project.WGS84.ToMercator)) {
        interiorSet.AddRange(id+1, i.PeekNext())
      }
    }
  }

  return boundarySet, interiorSet
}

func main() {
  dat, _ := ioutil.ReadFile("southamerica.geojson")
  geom, _ := geojson.UnmarshalGeometry(dat)
  polygon := geom.Geometry().(orb.Polygon)

  var m runtime.MemStats
  zoom := uint8(15)

  start := time.Now()
  if false {
    boundary, interior := BitmapCovering(zoom, polygon)
    fmt.Println("covering size", boundary.GetCardinality()+interior.GetCardinality())
  } else {
    covering, _ := tilecover.Polygon(polygon, maptile.Zoom(zoom))
    fmt.Println("covering size", len(covering))
  }
  runtime.ReadMemStats(&m)
  fmt.Println("megabytes", m.Alloc/1024/1024)
  fmt.Println("took", time.Since(start))
}
Input polygon southamerica.geojson:
{"type":"Polygon","coordinates":[[[-62.57541,14.915208],[-72.821509,14.915208],[-72.821509,14.915208],[-82.904973,6.291524],[-85.995066,-3.289539],[-73.959965,-23.278034],[-81.441244,-50.744789],[-72.821509,-57.406184],[-63.551229,-56.429744],[-58.184224,-42.141627],[-35.57775,-17.022015],[-31.186565,-5.235684],[-44.197485,2.400227],[-62.57541,14.915208]]]}